



Concept / Pie chart
Pie chart
A chart showing parts of a whole with circular sectors
A chart showing parts of a whole with circular sectors.

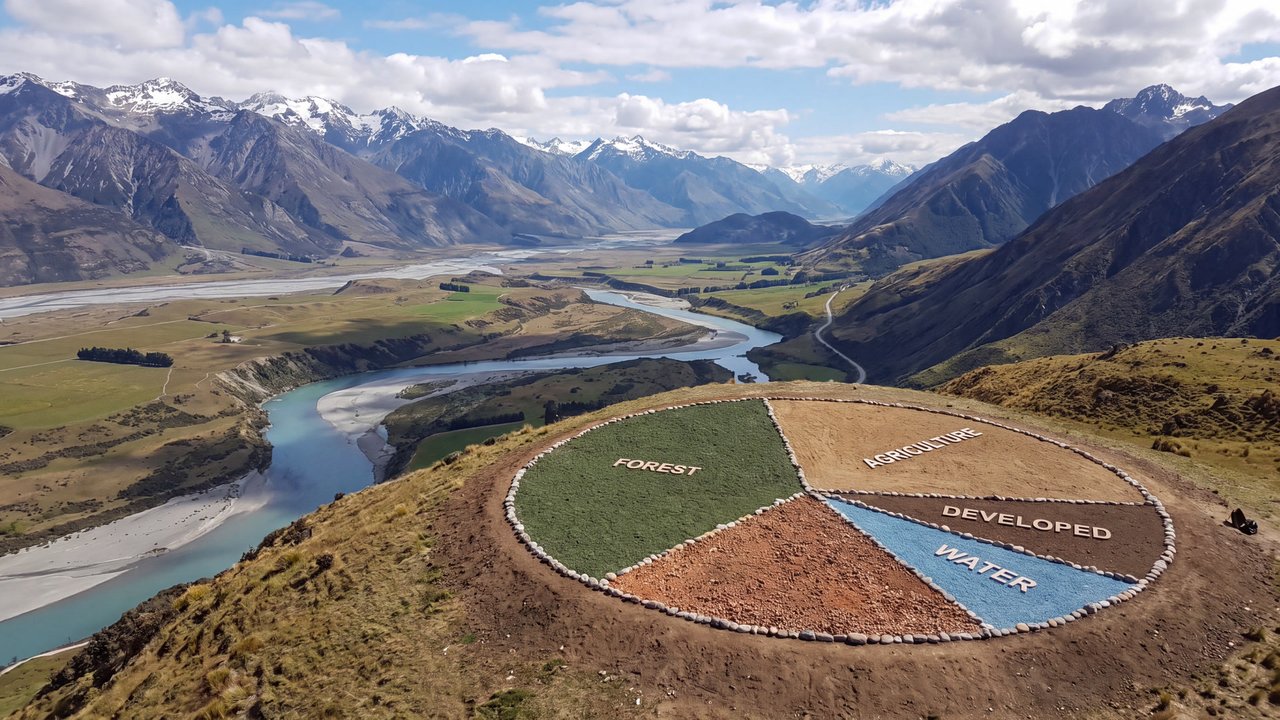
Valley with a river and mountain ranges
Both languages share the English example images. Japanese prompts are the recorded translations.
A phrase to start with
Divides a circle into sectors to show proportions.
Appearance and effects
Shows relationships of parts to a whole with colored sectors.
Visual traits
- circle
- sectors
- color coding
Expected changes
- Circular sections are more likely to appear
- Sections are more likely to be color-separated
Five examples
1 — Medium-sized dog
Open image ↗2 — Cat
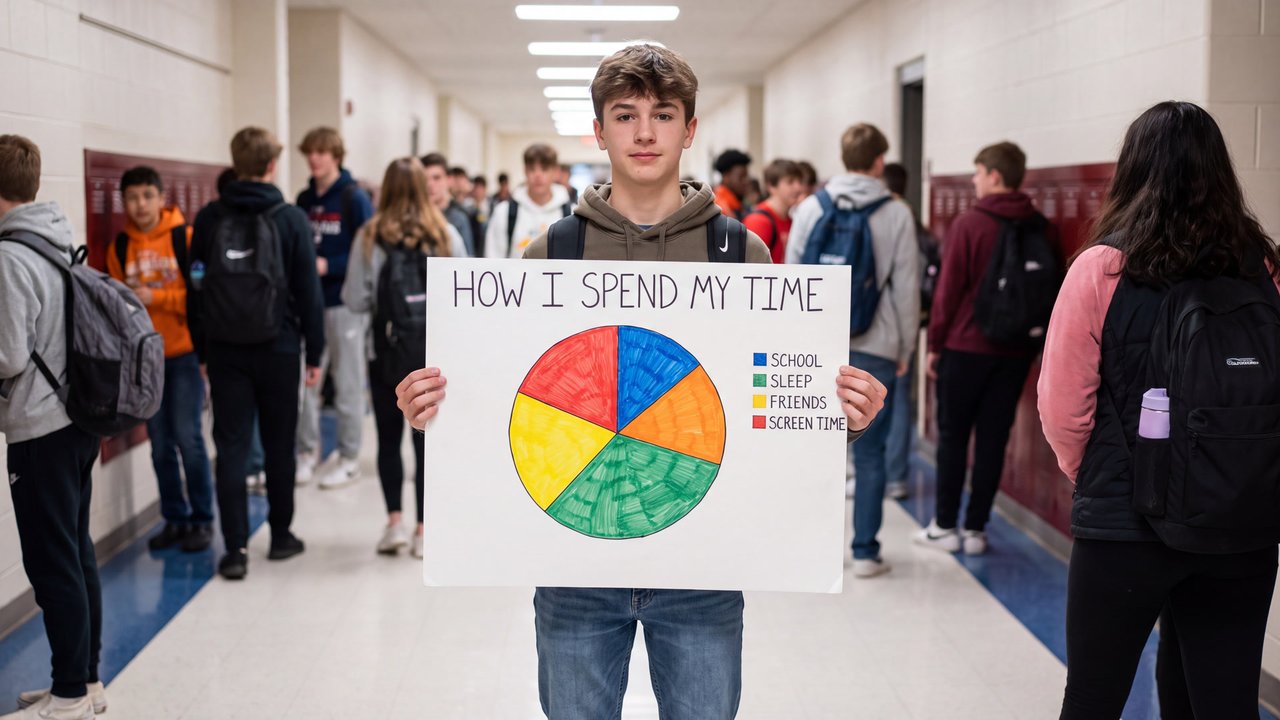
Open image ↗3 — Teenage boy
Open image ↗4 — Unoccupied interior
Open image ↗5 — Valley with a river and mountain ranges
Open image ↗Meaning and scope
Definition
A chart showing parts of a whole with circular sectors. It does not guarantee percentage accuracy or complete totals.
In more detail
It divides a circle into colored sectors to show relationships of parts to a whole. Values and categories remain separate choices.
Includes
- Charts showing proportions with sectors
Excludes
- Accurate statistics
- Complete totals
- Analytical conclusions
What this does not imply
- Accurate proportions
- Complete totals
- Analytical conclusions
Variability
Because the source is a weakly direct general reference, ratio and text legibility may vary.
Usage and adjustments
Usage
- Show parts and whole with sectors
- Specify values separately
Distinguish similar expressions
- Verify numerical accuracy separately
Typical uses
- Show proportions of a whole
- Compare a small number of categories
Possible failure modes
- Sector sizes do not match values
- Color coding cannot be distinguished
Content updated:
From the same theme
Items linked through explicit membership in the same theme.

Valley with a river and mountain ranges
Concept
Idea relationship diagram
An explanatory diagram showing elements and relationships through lines and placement.
Compare ↗
Valley with a river and mountain ranges
Concept
Comic panel
A framed area that separates one unit of content.
Compare ↗