



Concept / Line chart
Line chart
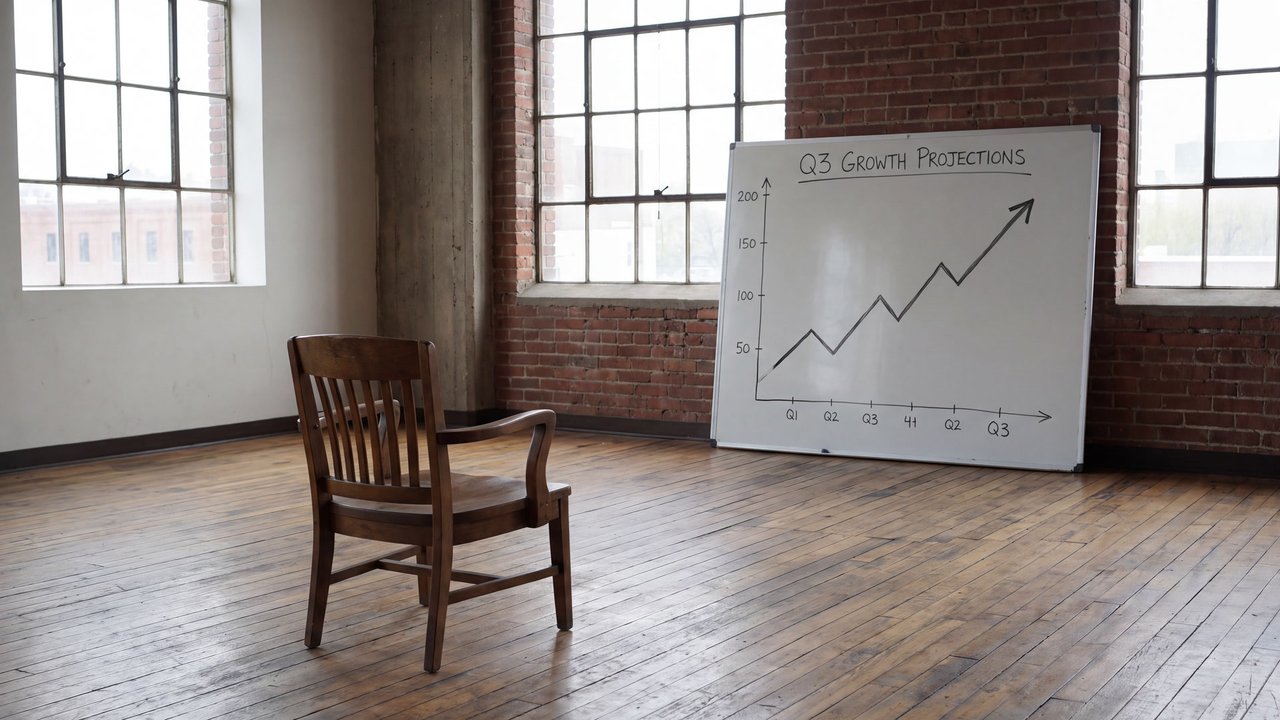
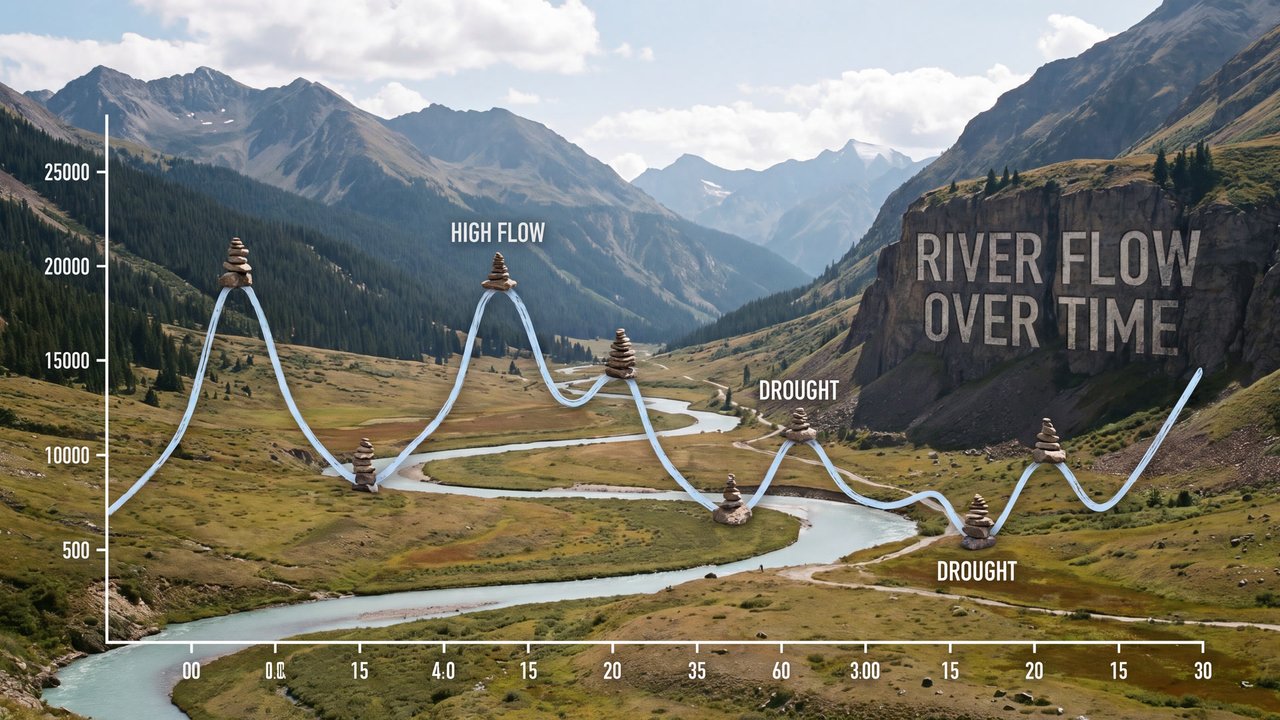
A chart showing changes in values with lines along axes
A chart showing changes in values with lines along axes.

Valley with a river and mountain ranges
Both languages share the English example images. Japanese prompts are the recorded translations.
A phrase to start with
Shows change through lines along axes.
Appearance and effects
Makes value changes readable through axes and connected points.
Visual traits
- horizontal axis
- vertical axis
- continuous line
Expected changes
- Axes and ticks are more likely to appear
- Points are more likely to be connected by lines
Five examples
1 — Medium-sized dog
Open image ↗2 — Cat
Open image ↗3 — Teenage boy
Open image ↗4 — Unoccupied interior
Open image ↗5 — Valley with a river and mountain ranges
Open image ↗Meaning and scope
Definition
A chart showing changes in values with lines along axes. It does not guarantee forecasts causation or accurate measurement.
In more detail
It connects points along horizontal and vertical axes so the shape of change can be read. Values remain separate choices.
Includes
- Charts showing change with axes and lines
Excludes
- Valid forecasts
- Proof of causation
- Accurate statistical results
What this does not imply
- Accurate measurement
- Forecasts
- Causation
Variability
Because the source is a weakly direct general reference, tick and value legibility may vary.
Usage and adjustments
Usage
- Keep axes and lines corresponding
- Specify values separately
Distinguish similar expressions
- Verify numerical accuracy separately
Typical uses
- Show change over time
- Compare multiple trends
Possible failure modes
- Lines detach from axes
- Values are unreadable and changes can be misread
Content updated:
From the same theme
Items linked through explicit membership in the same theme.

Valley with a river and mountain ranges
Concept
Idea relationship diagram
An explanatory diagram showing elements and relationships through lines and placement.
Compare ↗
Valley with a river and mountain ranges
Concept
Comic panel
A framed area that separates one unit of content.
Compare ↗